

Retailers are struggling to understand local conditions impacting each individual store location. Many are forced to rely on field teams or store managers to provide the insight needed to plan for the phased re-opening strategy.
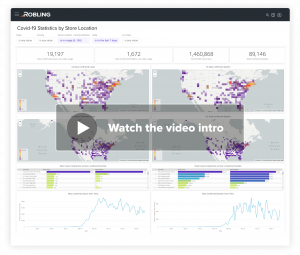
The Covid-19 Store Reopening Analytics dashboard provides a quick view of case density and trajectory for the US and allows the ability to drill down into the retailer’s individual store locations. This information is critical to helping retailers effectively plan for re-opening strategy, hours of operation, omnichannel demand, as well as adjust forecasts for store traffic and sales.
Logic and Robling have partnered to provide complimentary access to the COVID-19 Store Reopening Analytics dashboard.
Robling’s Store Reopening Analytics Dashboard provides retailers with fast and easy access to data and insights to inform phased reopening strategy. Access is free for retailers.
For each of your store locations, you’ll gain immediate insights into:
- Local case counts
- Local case trajectory
- State government mitigations and restrictions currently in place
You can also filter the data by state, county, date, and distance in miles from your store location.
You’ll need to share your store location hierarchy with Robling to tailor it to your business. Otherwise, the app will show you the case proximity based on 600 shopping mall locations across the U.S.